Direct answer: This page collects 160 US and global water statistics, each checked against its primary source on October 11, 2026. About 60% of USGS groundwater samples from drinking-water aquifers are hard or very hard, and the hardest public supplies we found run 15 to 25 grains per gallon. You can cite any number here; each one links to the government agency, university, utility or survey publisher that published it, and the full data is a free CSV download.
Publisher boundary: Water System Guide is an independent research publisher, not a manufacturer, dealer, installer, utility, or laboratory. Every figure below is reported as its publisher states it, with the publication or data date. Our own arithmetic (unit conversions only) is labelled as ours.
Key takeaways
- About 60% of USGS groundwater samples from aquifers used for drinking water were hard or very hard (1991–2010 data, published 2014). (USGS, 2014)
- Over 43 million people, about 15% of the US population, rely on private wells (EPA, updated August 2026). (U.S. EPA, 2026)
- EPA estimates 4 million lead service lines remain in the US, down from its 9.2 million projection in 2023 (EPA, November 2025). (U.S. EPA, 2025)
- 7.8% of US public water systems have at least one PFAS average above a 2024 EPA limit (UCMR 5 final data, July 2026). (U.S. EPA, 2026)
- 92.4% of people served by community water systems had no reported health-based violations in FY2023, up from 78.8% in FY1993 (EPA). (U.S. EPA, 2023)
- US drinking water systems need $625 billion in infrastructure investment over 20 years (EPA 7th DWINSA, 2023). (U.S. EPA, 2023)
- Water softeners contribute an estimated 65% of chloride reaching Minnesota’s municipal wastewater plants (University of Minnesota, 2021). (University of Minnesota, 2021)
- Waukesha, Wisconsin must meet its chloride limits by November 1, 2026, or it says it will further regulate salt-based softeners. (City of Waukesha, 2026)
- In Battelle’s 2009 test, electric water heaters on 26-gpg water built up 907 g of scale a year vs. 14 g on softened water. (Water Quality Research Foundation / Battelle, 2009)
- 56% of US adults worry “a great deal” about drinking water pollution, the top environmental worry in Gallup’s March 2026 poll. (Gallup, 2026)
- 1 in 4 people worldwide, 2.1 billion, lacked safely managed drinking water in 2024 (WHO/UNICEF, August 2025). (WHO and UNICEF Joint Monitoring Programme, 2025)
US hard water map: hardness by region and city
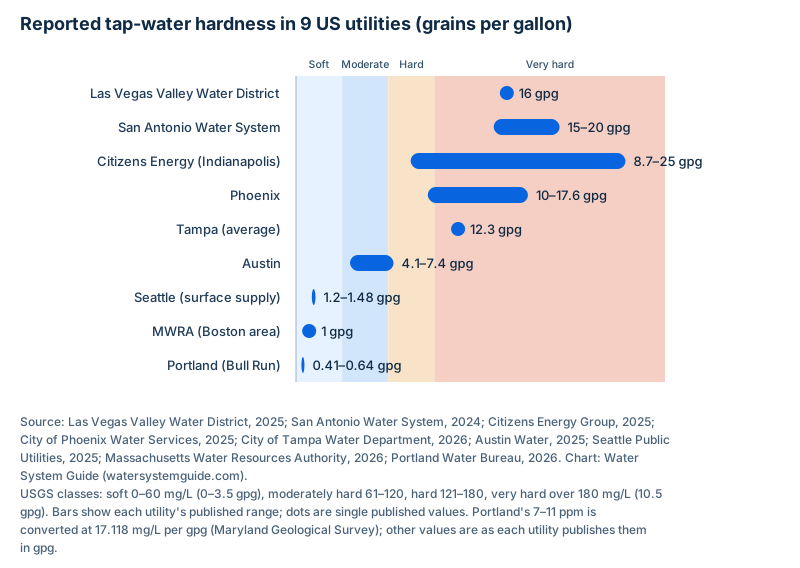
Hardness is mostly dissolved calcium and magnesium, reported in milligrams per liter (mg/L, the same as ppm) or grains per gallon (gpg) as calcium carbonate. USGS’s national map is old but still the reference; current utility reports show how wide the range is. Convert any test result with our water hardness calculator.
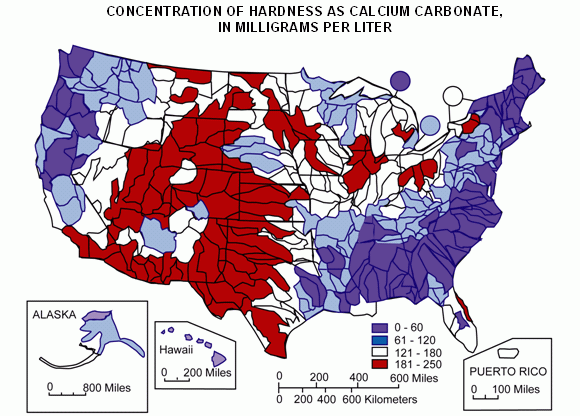
- USGS classifies water at 0–60 mg/L as calcium carbonate as soft, 61–120 mg/L as moderately hard, 121–180 mg/L as hard, and more than 180 mg/L as very hard. (USGS Water Science School, 2019)
- USGS says its 1975 hardness data have been found to be accurate and useful in current assessments. (USGS Water Science School, 2019)
- In USGS domestic-well sampling, hard water was most common in the east-central and western United States, reflecting carbonate aquifers and aquifers high in dissolved solids. (USGS Water Science School, 2019)
- USGS’s “Map of water hardness in the United States” shows mean hardness at NASQAN stream-monitoring sites in the 1975 water year, edited by EPA in 2005. (USGS, 1975)
- One grain per gallon of hardness equals 17.118 mg/L (ppm) as calcium carbonate, per the Maryland Geological Survey. (Maryland Geological Survey, 2026)
- Las Vegas Valley Water District’s 2026 water quality summary lists total hardness of 280 ppm, or 16 grains per gallon (samples collected August 12, 2025). (Las Vegas Valley Water District, 2025)
- Phoenix’s 2025 Water Quality Report gives total hardness of 172–302 ppm, or 10–17.6 grains per gallon, depending on location. (City of Phoenix Water Services, 2025)
- San Antonio Water System says the typical hardness of its Edwards and Trinity aquifer water ranges from 15 to 20 grains per gallon. (San Antonio Water System, 2024)
- Citizens Energy Group’s 2025 Indianapolis report lists average hardness of 292 ppm (17 grains per gallon) across its samples, with a system-wide range of 8.7–25 grains per gallon. (Citizens Energy Group, 2025)
- Tampa’s average finished-water hardness in 2025 was 211 mg/L, or 12.3 grains per gallon. (City of Tampa Water Department, 2026)
- Austin Water’s 2025 sampling shows total hardness averaging 93 ppm (5.4 grains per gallon), with a range of 70–126 ppm. (Austin Water, 2025)
- Seattle Public Utilities’ August 12, 2025 surface-water analysis reports hardness of about 1.2–1.5 grains per gallon. (Seattle Public Utilities, 2025)
- MWRA, which supplies Boston-area communities, says its water has a hardness of about 16 mg/L, or about 1 grain per gallon. (Massachusetts Water Resources Authority, 2026)
- Portland’s Bull Run supply typically has a total hardness of 7 to 11 ppm, about half a grain per gallon; its groundwater supply is about 80 ppm. (Portland Water Bureau, 2026)
- Minneapolis Water says its treatment removes about 65,000 pounds of hardness from its water each day. (City of Minneapolis, 2025)
- Denver Water describes its southern collection system as moderately hard and its northern system as somewhat soft. (Denver Water, 2026)
How many homes have hard water?
No federal survey counts homes with hard water. The best national evidence is USGS sampling of the aquifers that supply wells and many utilities. We could not find a primary source for the often-repeated claim that 85% of US homes have hard water, so we do not use it.
- Nationally, about 60% of USGS groundwater samples from the parts of aquifers used for drinking water were hard or very hard, and about 20% were naturally soft (1991–2010 data). (USGS, 2014)
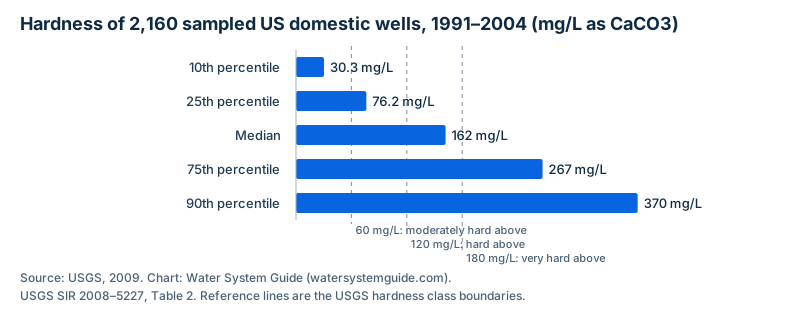
- The median hardness of 2,160 domestic (private) wells sampled by USGS in 1991–2004 was 162 mg/L as calcium carbonate, which is in USGS’s “hard” range. (USGS, 2009)
- 80% of the domestic wells in that USGS sample had hardness between 30.3 and 370 mg/L. (USGS, 2009)
- A quarter of those domestic wells exceeded 267 mg/L, and a tenth exceeded 370 mg/L (75th and 90th percentiles). (USGS, 2009)
- USGS found hard and very hard groundwater mainly in western and central aquifers and in carbonate and some sandstone aquifers in the East. (USGS, 2014)
- MPCA says the majority of Minnesota has hard to very hard groundwater, and roughly 75% of Minnesotans rely on groundwater for drinking (April 2026). (Minnesota Pollution Control Agency, 2026)
- Madison-area drinking water ranges from 14 to over 30 grains per gallon, according to the Madison Metropolitan Sewerage District. (Madison Metropolitan Sewerage District, 2019)
- EPA’s WaterSense softener guide treats water above 120 mg/L (about 7 grains per gallon) as hard (May 2026). (U.S. EPA, 2026)
- Penn State Extension notes that hardness below 7.0 grains per gallon will probably not cause major scaling and soap film. (Penn State Extension, 2026)
Water softener and home treatment adoption
There is no current federal count of household softeners. What exists is an industry survey, local studies where softeners are nearly universal, and EPA WaterSense figures on how much water softeners use. Sizing drives that water use; see our grain capacity guide and salt-based vs salt-free comparison.
- WQA’s 2025 Consumer Insights Report found water treatment product ownership up 35% since 2021. (Water Quality Association, 2025)
- In the same WQA survey, 91% of current users said they intend to keep using water treatment systems in their homes. (Water Quality Association, 2025)
- Over 90% of households in Morris, Minnesota used a water softener before the city built a central lime-softening plant in 2019, MPCA reports. (Minnesota Pollution Control Agency, 2026)
- Morris’s central softening plant cost $18 million, of which $12 million came from state aid (MPCA, April 2026). (Minnesota Pollution Control Agency, 2026)
- MMSD says water softeners are in nearly all buildings in its Madison-area service area because the groundwater is so hard. (Madison Metropolitan Sewerage District, 2019)
- Waukesha says most Milwaukee (Lake Michigan) water customers do not have softeners. (City of Waukesha, 2026)
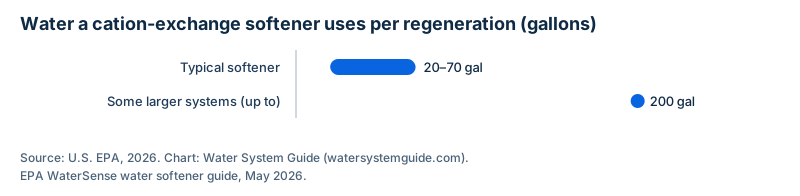
- A typical softener uses 20 to 70 gallons of water per regeneration cycle, and some larger systems use up to 200 gallons (EPA WaterSense, May 2026). (U.S. EPA, 2026)
- Efficient softeners can use 4 gallons of water or less per 1,000 grains of hardness removed (EPA WaterSense). (U.S. EPA, 2026)
- Softener regeneration can use 25 gallons of water or more per day, or up to 10,000 gallons per year, according to EPA WaterSense. (U.S. EPA, 2026)
- NSF/ANSI 44’s voluntary efficiency rating requires softeners to use 5.0 gallons of water or fewer per 1,000 grains of hardness removed (EPA, January 2025). (U.S. EPA, 2025)
- Penn State Extension says sodium-based softening adds 7.5 mg of sodium per quart for each grain per gallon of hardness removed. (Penn State Extension, 2026)
Public water systems and drinking water violations
About 9 in 10 Americans get tap water from a regulated public water system. EPA’s compliance data (SDWIS, reported through ECHO and the Report on the Environment) shows most people are served by systems with no health-based violations, but millions are not in a given year.
- There are over 148,000 public water systems in the United States (EPA, updated March 2026). (U.S. EPA, 2026)
- EPA-regulated public drinking water systems provide drinking water to 90% of Americans. (U.S. EPA, 2026)
- There are approximately 50,000 community water systems, which serve the same population year-round (EPA FY2025 Annual Performance Report). (U.S. EPA, 2026)
- In FY2023, more than 320 million people, roughly 95% of the U.S. population, got at least some of their drinking water from a community water system. (U.S. EPA, 2023)
- The share of people served by community systems with no reported health-based violations rose from 78.8% in FY1993 to 92.4% in FY2023. (U.S. EPA, 2023)
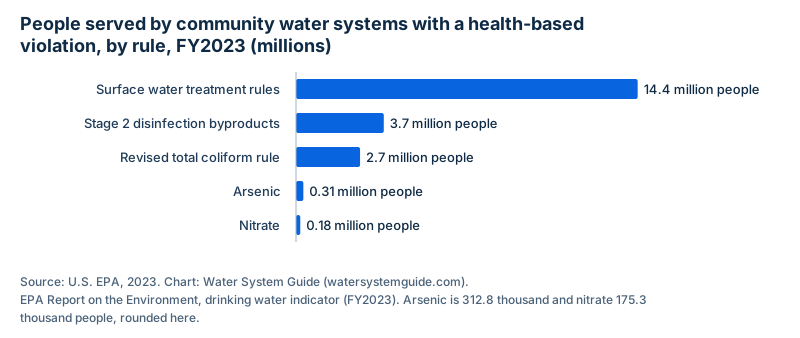
- In FY2023, surface water treatment rule violations affected 14.4 million people (4.5% of the population served by community systems). (U.S. EPA, 2023)
- Stage 2 disinfection byproduct violations affected 3.7 million people in FY2023. (U.S. EPA, 2023)
- Revised total coliform rule, arsenic and nitrate violations affected 2.7 million, 312.8 thousand and 175.3 thousand people respectively in FY2023. (U.S. EPA, 2023)
- In FY2022, over 18,000 community water systems had at least one SDWA violation and almost 3,000 had a health-based violation. (U.S. EPA, 2026)
- Those FY2022 health-based violations meant about 22 million Americans drank water with at least one violation of a health-based standard. (U.S. EPA, 2026)
- 93% of community water systems met all applicable health-based drinking water standards in FY2025. (U.S. EPA, 2026)
- As of September 30, 2025, 357 of 3,508 community systems that were out of compliance in 2017 were still in noncompliance with health-based standards. (U.S. EPA, 2026)
- EPA completed 419 Safe Drinking Water Act enforcement actions in FY2025. (U.S. EPA, 2026)
- EPA’s 7th Drinking Water Infrastructure Needs Survey estimates $625 billion in drinking water infrastructure needs over 20 years. (U.S. EPA, 2023)
- Of that need, $422.9 billion is for distribution and transmission pipes and $107 billion is for treatment. (U.S. EPA, 2023)
- Storage needs total $56.1 billion and source needs total $25.2 billion. (U.S. EPA, 2023)
- CDC estimates at least 1.1 million people in the United States get sick every year from germs in drinking water, about 1 in every 300 people (August 2024). (CDC, 2024)
- Legionella was the leading cause of outbreaks linked to both public and private drinking water in 2010–2022, according to CDC. (CDC, 2024)
- A CDC study estimated 7.15 million waterborne illnesses in the U.S. in 2014, causing 120,000 hospitalizations and 6,600 deaths across all water exposure routes. (CDC Emerging Infectious Diseases, 2023)
- Of those, 1.13 million illnesses in 2014 were linked to drinking water, which caused 40% of waterborne-illness hospitalizations. (CDC Emerging Infectious Diseases, 2023)
Lead service lines
EPA’s national lead service line count has changed sharply as water systems filed real inventories, due October 16, 2024. Older estimates were survey projections; the 2025 figure uses inventory data.
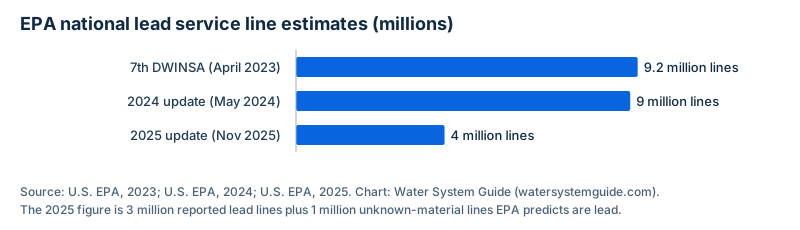
- EPA’s 7th DWINSA (2023) projected 9.2 million lead service lines nationwide. (U.S. EPA, 2023)
- EPA’s 2024 update projected 9 million lead service lines. (U.S. EPA, 2024)
- Using 2025 service line inventory data, EPA now estimates 4 million lead service lines across the country (November 2025). (U.S. EPA, 2025)
- That 4.0 million comprises 3 million reported lead lines and 1 million “unknown” lines EPA predicts are lead. (U.S. EPA, 2025)
- The Infrastructure Investment and Jobs Act appropriated $15 billion to the DWSRF specifically for lead service line replacement. (U.S. EPA, 2025)
- Initial service line inventories were due from water systems by October 16, 2024. (U.S. EPA, 2025)
- EPA’s Lead and Copper Rule Improvements, issued October 8, 2024, require most water systems to identify and replace lead pipes within 10 years. (U.S. EPA, 2024)
- The LCRI lowers the lead action level from 15 µg/L to 10 µg/L. (U.S. EPA, 2024)
- EPA estimates the LCRI’s public health and economic benefits at up to 13 times its costs. (U.S. EPA, 2024)
- Benton Harbor, Michigan and Green Bay, Wisconsin replaced their lead service lines in less than 10 years, EPA says. (U.S. EPA, 2024)
- In EPA’s 2023 update to the 7th DWINSA, Illinois (1,071,355) and Florida (1,014,952) had the most projected lead service lines, followed by Ohio (809,990); EPA flagged Florida’s and Texas’s original reporting as unreliable. (U.S. EPA, 2025)
PFAS in drinking water
EPA’s 2024 rule set the first national PFAS limits, and the final UCMR 5 results (July 2026) show how many systems are above them. EPA proposed changes to the rule in May 2026; the limits below are the 2024 rule unless noted. Our NSF-certified filter guide covers home treatment claims.
- EPA’s April 10, 2024 PFAS rule set enforceable limits of 4.0 parts per trillion each for PFOA and PFOS. (U.S. EPA, 2026)
- The 2024 rule set 10 ppt limits for PFHxS, PFNA and HFPO-DA (GenX) and a Hazard Index of 1 for mixtures. (U.S. EPA, 2026)
- EPA expects the 2024 rule to prevent PFAS exposure in drinking water for approximately 100 million people over many years. (U.S. EPA, 2026)
- On May 18, 2026, EPA proposed keeping the PFOA and PFOS limits while letting systems request two additional years, to 2031, to comply. (U.S. EPA, 2026)
- EPA’s second May 2026 proposal would rescind the limits for PFHxS, PFNA, HFPO-DA and the Hazard Index mixture. (U.S. EPA, 2026)
- EPA estimated in April 2024 that the rule would cost about $1.548 billion per year. (U.S. EPA, 2024)
- EPA estimated 4,100–6,700 public water systems serving 83–105 million people would need to act on PFAS. (U.S. EPA, 2024)
- About 66,000 regulated water systems must complete PFAS monitoring and notification under the 2024 rule. (U.S. EPA, 2024)
- The final UCMR 5 dataset (July 2026) covers about 10,130 public water systems and about 25,950 sampling locations. (U.S. EPA, 2026)
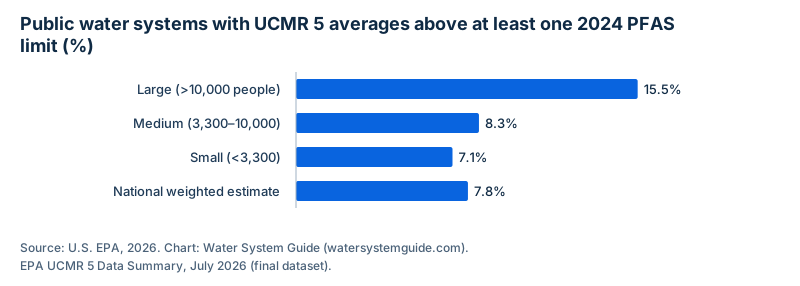
- 15.5% of large systems (serving more than 10,000 people) had UCMR 5 averages above at least one 2024 PFAS limit. (U.S. EPA, 2026)
- 8.3% of systems serving 3,300–10,000 people and 7.1% of systems serving fewer than 3,300 had averages above a 2024 PFAS limit. (U.S. EPA, 2026)
- EPA’s weighted national estimate is that 7.8% of public water systems have at least one average above a 2024 PFAS limit. (U.S. EPA, 2026)
- 12.2% of large systems had PFOS averages above 4.0 ppt, and 11.0% had PFOA averages above 4.0 ppt. (U.S. EPA, 2026)
- 66% of UCMR 5 sampling locations with at least one PFAS detection had multiple PFAS at or above reporting levels. (U.S. EPA, 2026)
- 3,183 sampling locations from 1,874 water systems had three or more different PFAS. (U.S. EPA, 2026)
- 28.5% of systems serving 10,000 or fewer people and 24.1% of larger systems reported lithium above EPA’s health reference level. (U.S. EPA, 2026)
- USGS estimates at least 45% of the nation’s tap water has one or more PFAS, based on samples from 716 locations in 2016–2021. (USGS, 2023)
- USGS estimates the probability of PFAS not being observed in tap water is about 75% in rural areas and around 25% in urban areas. (USGS, 2023)
Private wells, nitrate and arsenic
Private wells are not covered by the Safe Drinking Water Act, so testing is up to the owner. USGS’s national domestic-well study is the most complete picture of what those wells contain. Start with our well water testing guide.
- Around 15% of the U.S. population, over 43 million people, rely on private wells for drinking water (EPA, updated August 2026). (U.S. EPA, 2026)
- EPA estimates that more than 23 million households rely on private wells for drinking water. (U.S. EPA, 2026)
- Private wells are not regulated under the Safe Drinking Water Act (EPA). (U.S. EPA, 2026)
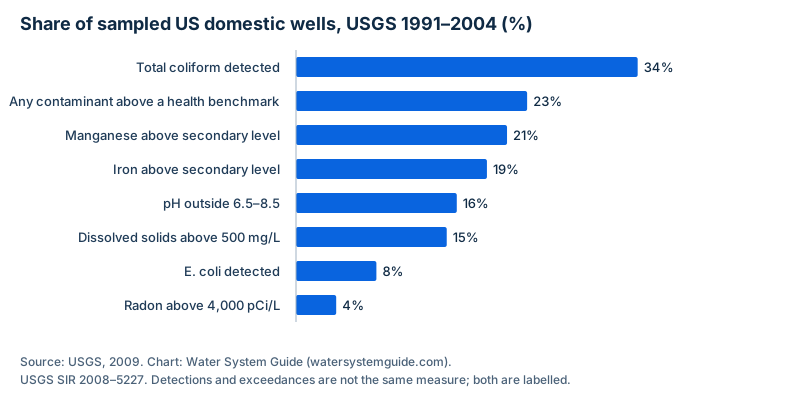
- About 23% of domestic wells sampled by USGS had at least one contaminant above a human-health benchmark. (USGS, 2009)
- Radon exceeded the lower proposed MCL (300 pCi/L) in about 65% of sampled domestic wells and the higher proposed MCL (4,000 pCi/L) in about 4%. (USGS, 2009)
- Nitrate, arsenic, manganese, strontium and gross alpha radioactivity each exceeded health benchmarks in about 5% to 7% of domestic wells. (USGS, 2009)
- Total coliform bacteria were detected in about 34% of sampled domestic wells and E. coli in about 8%. (USGS, 2009)
- Iron exceeded EPA’s secondary (aesthetic) level in about 19% of domestic wells and manganese in about 21%. (USGS, 2009)
- About 15% of domestic wells had total dissolved solids above EPA’s 500 mg/L secondary level. (USGS, 2009)
- About 16% of domestic wells had pH outside EPA’s recommended 6.5–8.5 range. (USGS, 2009)
- Nitrate exceeded the MCL more often in agricultural areas than in other land-use settings. (USGS, 2009)
- USGS and CDC estimate about 2.1 million people may drink private-well water with arsenic above 10 µg/L (2017). (USGS and CDC, 2017)
- That arsenic model was built from water samples from more than 20,000 domestic wells. (USGS and CDC, 2017)
- One in every five wells sampled in USGS’s 1991–2010 principal-aquifer studies had a contaminant at a level of potential human-health concern. (USGS, 2014)
Chloride and water softener regulation
Salt-based softeners send chloride to the sewer, and wastewater plants cannot remove it. That is why Wisconsin and Minnesota utilities now regulate or pay for softener changes. See our Waukesha softener rules guide.
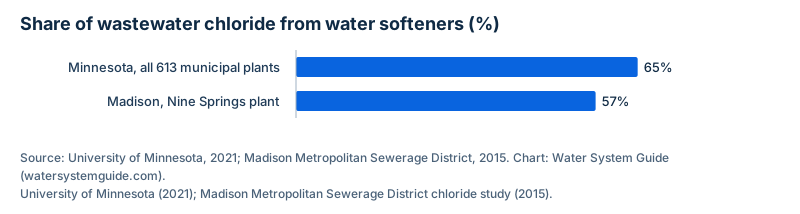
- University of Minnesota researchers estimated that roughly 65% of chloride passing through Minnesota wastewater plants, about 136,000 tons a year, comes from water softening (cited by MPCA, April 2026). (Minnesota Pollution Control Agency, 2026)
- Water softeners were estimated to contribute 65% of chloride discharged to all 613 municipal wastewater plants in Minnesota. (University of Minnesota, 2021)
- Minnesota applies an estimated 403,600 tons of deicing salt each year, and more than 70% of it reaches lakes, rivers, streams and groundwater. (Minnesota Pollution Control Agency, 2026)
- 68 Minnesota water bodies are impaired by chloride, 14 of them added in 2024, and 75 more are high-risk. (Minnesota Pollution Control Agency, 2026)
- Minnesota’s chloride water quality standard is 230 mg/L. (Minnesota Pollution Control Agency, 2026)
- 40% of wells tested across Minnesota show increasing chloride (2019 MPCA data). (Minnesota Pollution Control Agency, 2026)
- Organizations trained in MPCA Smart Salting have reduced their salt use by 30% to 70%. (Minnesota Pollution Control Agency, 2026)
- Water softeners contribute about 57% of the annual average chloride load to Madison’s Nine Springs wastewater plant, 80,500 of 141,958 pounds per day. (Madison Metropolitan Sewerage District, 2015)
- In the same MMSD study, industrial input was 18% of chloride load and road de-icing 7%. (Madison Metropolitan Sewerage District, 2015)
- MMSD found softener optimization reduced chloride by 27% and softener replacement by 47% in a small sample. (Madison Metropolitan Sewerage District, 2019)
- The City of Waukesha must meet its chloride permit limits by November 1, 2026, or it says it will be forced to further regulate softeners, including banning salt-based units with very limited exceptions. (City of Waukesha, 2026)
- Waukesha’s code requires new or replacement softeners to have a salt efficiency rating of at least 4,000 grains of hardness exchanged per pound of salt. (City of Waukesha, 2026)
- Waukesha says optimizing a softener and adjusting it to Lake Michigan hardness can achieve as much as 80% of the salt reduction of removing it. (City of Waukesha, 2026)
- Waukesha switched to 100% Lake Michigan water in October 2023; the city says that water is 60% softer than its previous groundwater. (City of Waukesha, 2026)
- As of November 13, 2025, 1,876 Waukesha softeners had been disconnected through the city’s rebate program. (Wisconsin DNR, 2026)
- Waukesha’s 2025 softener rebate was $200, reduced to $150 after July 1, 2025 (Wisconsin DNR, 2026). (Wisconsin DNR, 2026)
- Waukesha’s return-flow chloride ranged from 321 to 385 mg/L between October 2024 and September 2025. (Wisconsin DNR, 2026)
- Root River chloride stayed below the 395 mg/L chronic water quality criterion throughout that reporting period. (Wisconsin DNR, 2026)
- Lathrop, California’s municipal code prohibits installing residential self-regenerating water softeners in its water recycling plant service area. (City of Lathrop, California, 2026)
- California’s San Miguel Community Services District adopted its ordinance restricting self-regenerating softeners on May 9, 2005. (San Miguel Community Services District, California, 2005)
- MMSD says a typical single-family home uses less than one 40-pound bag of softener salt per month. (Madison Metropolitan Sewerage District, 2026)
- MMSD puts the average lifespan of a water softener at about 15 years. (Madison Metropolitan Sewerage District, 2026)
Salt use: how much goes to water softening
USGS tracks salt by end use. Water treatment and water-conditioning (softener) salt is small next to road deicing and the chemical industry. Our softener salt guide covers the salt types.
- The U.S. produced an estimated 40 million metric tons of salt in 2025 (USGS, January 2026). (USGS National Minerals Information Center, 2026)
- About 39 million tons of salt were sold or used in 2025, valued at an estimated $2.6 billion. (USGS National Minerals Information Center, 2026)
- Highway deicing accounted for about 37% of U.S. salt consumed in 2025, and the chemical industry for about 42% of sales. (USGS National Minerals Information Center, 2026)
- Seven states, Kansas, Louisiana, Michigan, New York, Ohio, Texas and Utah, produced about 95% of U.S. salt in 2025. (USGS National Minerals Information Center, 2026)
- USGS puts the 2025 average value of vacuum and open pan salt at about $260 per metric ton, vs. about $54 for rock salt. (USGS National Minerals Information Center, 2026)
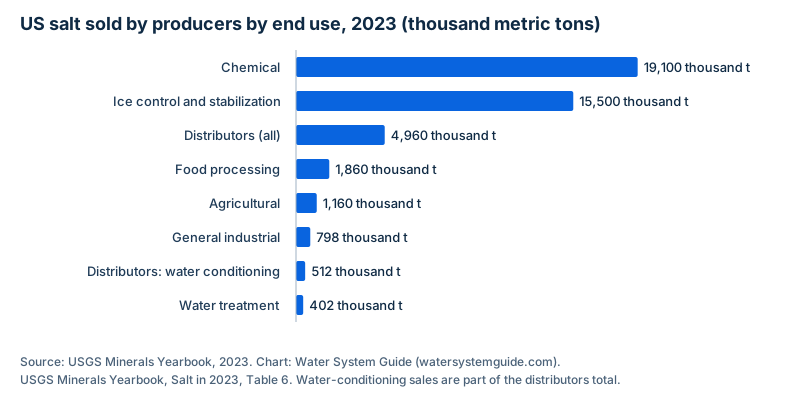
- Salt producers sold 402,000 metric tons of salt directly for water treatment in 2023. (USGS Minerals Yearbook, 2023)
- Distributors sold another 512,000 metric tons for water conditioning in 2023. (USGS Minerals Yearbook, 2023)
- Ice control used 15.5 million metric tons of producers’ salt in 2023, about 39 times the direct water-treatment total. (USGS Minerals Yearbook, 2023)
- USGS says salt for water conditioning is compressed into pellets, and in 2019, 650,000 t was sold for primary water treatment plus 510,000 t for water conditioning by distributors. (USGS Minerals Yearbook, 2022)
- By type, 2025 U.S. salt sold or used was 44% salt in brine, 38% rock salt, 9% solar salt and 9% vacuum pan salt (USGS estimate). (USGS National Minerals Information Center, 2026)
- U.S. imports for consumption were an estimated 19 million metric tons of salt in 2025, and net import reliance was 31% of apparent consumption. (USGS National Minerals Information Center, 2026)
- Salt was produced by 25 companies operating 60 plants in 15 states in 2025. (USGS National Minerals Information Center, 2026)
Hard water effects on water heaters and appliances
The best-known test is the 2009 Battelle study for the Water Quality Research Foundation, an industry-funded research foundation. It used accelerated scaling at 26 gpg, so read it as a worst-case lab test, not a typical home.
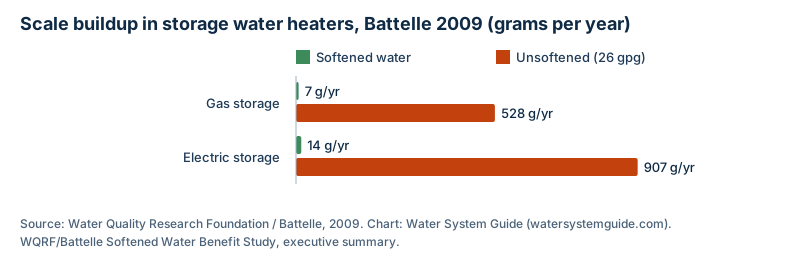
- In the 2009 Battelle study for the Water Quality Research Foundation, gas storage water heaters on unsoftened water accumulated about 528 g of scale a year vs. about 7 g on softened water. (Water Quality Research Foundation / Battelle, 2009)
- Electric storage water heaters on unsoftened water accumulated about 907 g of scale a year vs. about 14 g on softened water. (Water Quality Research Foundation / Battelle, 2009)
- Gas storage heater efficiency on unsoftened water dropped from 70.4% to 67.4% at two years of equivalent service. (Water Quality Research Foundation / Battelle, 2009)
- Tankless gas heaters on unsoftened water fell from 80% to 72% efficiency and had to be delimed at 1.6 years of equivalent service. (Water Quality Research Foundation / Battelle, 2009)
- Low-flow showerheads on unsoftened water clogged after an average of 3,203 gallons of flow; those on softened water did not. (Water Quality Research Foundation / Battelle, 2009)
- Battelle’s test water was 26 grains per gallon, and dishwashers and washers on it showed visible scale after 30 days (240 cycles). (Water Quality Research Foundation / Battelle, 2009)
- Battelle tested 30 water heaters over 90 days in an accelerated-scaling protocol approved by WQA, which supplied the heaters. (Water Quality Research Foundation / Battelle, 2009)
- USGS says scale from heated hard water can shorten equipment life, raise water-heating costs and lower electric water heater efficiency. (USGS Water Science School, 2019)
- WHO’s hardness background document proposes no health-based guideline value for hardness. (World Health Organization, 2011)
- WHO puts the taste threshold for the calcium ion at 100–300 mg/L, depending on the associated anion. (World Health Organization, 2011)
Consumer concern about drinking water
Only original survey publishers are used here. Gallup’s annual environment poll is the longest-running measure; WQA publishes an industry consumer survey. Before acting on an in-home sales test, read our free water test guide.
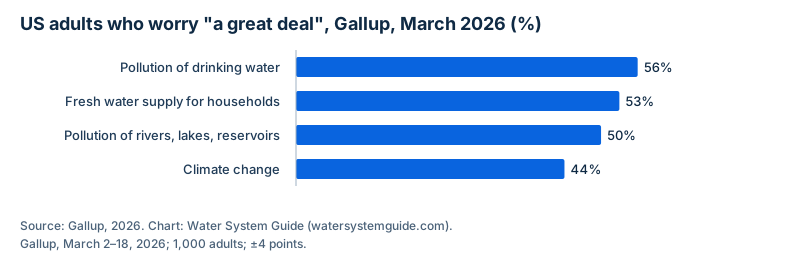
- 56% of Americans worried “a great deal” about pollution of drinking water in Gallup’s March 2–18, 2026 poll, the top worry among eight environmental problems tested. (Gallup, 2026)
- 53% worried a great deal about maintaining the nation’s supply of fresh water for household needs. (Gallup, 2026)
- Half of U.S. adults worried a great deal about pollution of rivers, lakes and reservoirs. (Gallup, 2026)
- Water pollution has ranked as Americans’ top environmental concern in Gallup polling since 2001. (Gallup, 2026)
- 44% of U.S. adults worried a great deal about climate change, below drinking water pollution. (Gallup, 2026)
- Gallup’s 2026 sample was 1,000 adults interviewed by phone, with a margin of error of ±4 percentage points. (Gallup, 2026)
- WQA’s 2025 report found 58% of U.S. households are concerned about tap water safety. (Water Quality Association, 2025)
- The Minnesota Department of Health says close to 100% of the state’s community water suppliers meet EPA MCLs, and warns residents about water treatment sales pitches. (Minnesota Department of Health, 2026)
- 9 out of 10 people in the U.S. get their tap water from a regulated public water system, per CDC. (CDC, 2024)
Global access to safe drinking water
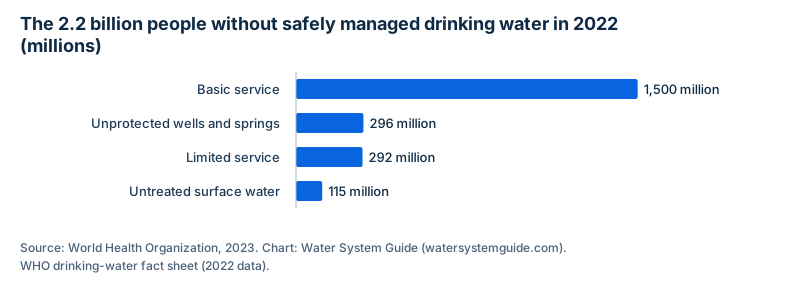
WHO and UNICEF’s Joint Monitoring Programme is the source for global drinking water access. Its 2025 update covers 2024; the WHO fact sheet breaks down 2022.
- 1 in 4 people worldwide, 2.1 billion, still lacked safely managed drinking water in 2024 (WHO/UNICEF, August 2025). (WHO and UNICEF Joint Monitoring Programme, 2025)
- That includes 106 million people who drink directly from untreated surface water. (WHO and UNICEF Joint Monitoring Programme, 2025)
- Rural safely managed drinking water coverage rose from 50% to 60% between 2015 and 2024. (WHO and UNICEF Joint Monitoring Programme, 2025)
- In fragile contexts, safely managed drinking water coverage is 38 percentage points lower than in other countries. (WHO and UNICEF Joint Monitoring Programme, 2025)
- In 2022, 73% of the global population (6 billion people) used a safely managed drinking-water service. (World Health Organization, 2023)
- In 2022, at least 1.7 billion people used a drinking water source contaminated with feces. (World Health Organization, 2023)
- Of the 2.2 billion without safely managed water in 2022, 1.5 billion had basic services, 292 million limited services, 296 million used unprotected wells and springs, and 115 million used surface water. (World Health Organization, 2023)
- Contaminated drinking water is estimated to cause approximately 505,000 diarrhoeal deaths each year (WHO). (World Health Organization, 2023)
How we built and verified these statistics
- Primary sources only. Every statistic comes from the organization that produced it: federal agencies (USGS, EPA, CDC), state agencies, universities, water utilities, WHO/UNICEF, the original survey publisher (Gallup, WQA) or the research foundation that commissioned a study. We did not use roundup blogs or vendor pages that repeat numbers without a source.
- Every number checked against the live source. On 2026-10-11 we fetched each of the 64 source URLs, converted HTML and PDF documents to text, and matched the exact wording or table value for every statistic. The research ledger records the quote, the source date, the retrieval date and the HTTP status for each one. One CDC page blocks automated requests; we read it with a browser-style reader and noted that in the ledger.
- Dated, not blended. Statistics keep their own dates. Where agencies have revised a number (EPA’s lead service line count fell from 9.2 million to 4 million as real inventories arrived), we show each estimate with its date rather than picking one.
- What we left out. We dropped figures we could not trace to a primary source, including the widely repeated “85% of US homes have hard water,” and market-size figures that appear only in paywalled press releases.
- Charts. Every chart is drawn by Water System Guide from the cited values. The USGS hardness map is a public-domain USGS image.
- Last updated: 2026-10-11. Refresh schedule: quarterly (next review by 2027-01-11) and within 30 days of a new EPA UCMR, DWINSA, USGS Mineral Commodity Summaries or Gallup environment release.
- Data download: hard-water-statistics-2026.csv lists every statistic with its source URL and dates.
Cite this page
Journalists, students and researchers are welcome to use these statistics. Please cite the original source linked beside each number, and link to this page as the compilation:
Water System Guide. “Hard Water Map & Water Quality Statistics (2026).” Updated October 11, 2026. https://watersystemguide.com/guides/hard-water-statistics/
Our charts may be reused with a link to this page.
Related Water System Guide research
- Water hardness calculator converts mg/L, ppm and grains per gallon.
- Water softener sizing guide and grain capacity guide turn a hardness result into a softener size.
- Well water testing guide covers what private well owners should test for.
- Waukesha water softener rules explains the chloride deadline and rebate.
- Salt-based vs salt-free softeners and the water softener salt guide cover salt use at home.
- Free water test and dealer quotes explains how in-home sales tests work.
Frequently asked questions
How many homes in the US have hard water?
No federal survey counts homes with hard water. USGS found that about 60% of groundwater samples from aquifers used for drinking water were hard or very hard (1991–2010 data), and the median of 2,160 sampled domestic wells was 162 mg/L, which USGS classes as hard. We found no primary source for the widely repeated 85% figure.
What percentage of US homes have a water softener?
We could not find a current federal or peer-reviewed national figure. Local data show how much it varies: MPCA reports over 90% of households in Morris, Minnesota had softeners before central softening, while the City of Waukesha says most Milwaukee water customers do not have one. WQA’s 2025 survey says water treatment product ownership is up 35% since 2021.
Where is the hardest water in the US?
USGS data show hard water is most common in the east-central and western US, where carbonate aquifers and high dissolved solids are common. Among the utility reports we checked, San Antonio (15 to 20 gpg), Indianapolis (up to 25 gpg) and Las Vegas (16 gpg) were among the hardest, and Portland, Boston-area MWRA and Seattle were among the softest.
How many Americans get their water from private wells?
EPA says around 15% of the US population, over 43 million people, rely on private wells, and more than 23 million households. Private wells are not regulated under the Safe Drinking Water Act, so owners are responsible for testing.
Is hard water bad for your health?
WHO’s hardness background document proposes no health-based guideline value for hardness. Hardness mainly causes scale: USGS says scale can shorten equipment life and lower water heater efficiency.
Sources
- USGS Water Science School. Hardness of Water. 2019-10-22 (page updated 2026-08-24). Retrieved 2026-10-11.
- USGS. Map of water hardness in the United States. 1975 water-year data; image page updated 2026-08-24. Retrieved 2026-10-11.
- Maryland Geological Survey. Hardness of groundwater in Maryland. retrieved 2026-10-11. Retrieved 2026-10-11.
- Las Vegas Valley Water District. 2026 Water Quality Summary. samples 2025-08-12. Retrieved 2026-10-11.
- City of Phoenix Water Services. 2025 Water Quality Report. 2025. Retrieved 2026-10-11.
- San Antonio Water System. Water Quality FAQs. updated 2024-05-24. Retrieved 2026-10-11.
- Citizens Energy Group (Indianapolis). 2025 Drinking Water Report. 2025-06-17. Retrieved 2026-10-11.
- City of Tampa Water Department. 2025 Water Quality Report. 2026 (2025 data). Retrieved 2026-10-11.
- Austin Water. Water Quality Reports (2025 sampling). 2025 data. Retrieved 2026-10-11.
- Seattle Public Utilities. Quarterly surface water analysis. 2025-08-12. Retrieved 2026-10-11.
- Massachusetts Water Resources Authority. FAQ about MWRA tap water. retrieved 2026-10-11. Retrieved 2026-10-11.
- Portland Water Bureau. 2026 Drinking Water Quality Report. 2026. Retrieved 2026-10-11.
- City of Minneapolis. Water Treatment & Delivery. updated 2025-09-05. Retrieved 2026-10-11.
- Denver Water. Water Hardness. retrieved 2026-10-11. Retrieved 2026-10-11.
- USGS (DeSimone, Mcmahon and Rosen). Circular 1360: Water Quality in Principal Aquifers of the United States, 1991–2010. 2014 (data 1991–2010). Retrieved 2026-10-11.
- USGS (DeSimone). SIR 2008–5227: Quality of Water from Domestic Wells in Principal Aquifers of the United States, 1991–2004. 2009 (samples 1991–2004). Retrieved 2026-10-11.
- Minnesota Pollution Control Agency. Smart Salting for Community Leaders Handbook. April 2026. Retrieved 2026-10-11.
- Madison Metropolitan Sewerage District. Chloride Compliance Plan: first variance term recap. 2019. Retrieved 2026-10-11.
- U.S. EPA WaterSense. Water softener guide. May 2026. Retrieved 2026-10-11.
- Penn State Extension. Water Softening. retrieved 2026-10-11. Retrieved 2026-10-11.
- Water Quality Association. What Consumers Really Think About Their Water (2025 Consumer Insights Report). 2025-10-22. Retrieved 2026-10-11.
- City of Waukesha. Softener Salt Program. retrieved 2026-10-11. Retrieved 2026-10-11.
- U.S. EPA WaterSense. Cation Exchange Water Softeners. updated 2026-05-08. Retrieved 2026-10-11.
- U.S. EPA WaterSense. Home water treatment guide. January 2025. Retrieved 2026-10-11.
- U.S. EPA. Information about Public Water Systems. updated 2026-03-16. Retrieved 2026-10-11.
- U.S. EPA. FY 2025 Annual Performance Report. April 2026 (FY2025). Retrieved 2026-10-11.
- U.S. EPA Report on the Environment. Drinking Water indicator: population served by CWS with no reported health-based violations. FY2023 data (sources accessed 2024; page footer: last updated 2023-10-04). Retrieved 2026-10-11.
- U.S. EPA. National Enforcement and Compliance Initiative: Increasing Compliance with Drinking Water Standards. updated 2026-03-09. Retrieved 2026-10-11.
- U.S. EPA. 7th Drinking Water Infrastructure Needs Survey and Assessment. 2023 report; page updated 2026-05-20. Retrieved 2026-10-11.
- CDC. Drinking Water Facts and Stats. 2024-08-06. Retrieved 2026-10-11 (blocks automated requests; verified with a browser-style reader).
- CDC Emerging Infectious Diseases (Gerdes et al.). Estimating Waterborne Infectious Disease Burden by Exposure Route, United States, 2014. July 2023 (2014 data). Retrieved 2026-10-11.
- U.S. EPA. 7th DWINSA public fact sheet. 2023-04-04. Retrieved 2026-10-11.
- U.S. EPA. Updated 7th DWINSA fact sheet. May 2024. Retrieved 2026-10-11.
- U.S. EPA. 2025 Update to the 7th DWINSA fact sheet. November 2025. Retrieved 2026-10-11.
- U.S. EPA. 2025 Update to the 7th DWINSA and approach for FY2025–2026 LSLR allotments (memo). 2025-01-17. Retrieved 2026-10-11.
- U.S. EPA. Lead and Copper Rule Improvements. final rule 2024-10-08; page updated 2025-12-29. Retrieved 2026-10-11.
- U.S. EPA. Final LCRI fact sheet for the general public. October 2024. Retrieved 2026-10-11.
- U.S. EPA. 2023 Update to the 7th DWINSA, Lead Service Line Information: Addendum to the Report to Congress (Exhibit 6). January 2025 (2023 update data). Retrieved 2026-10-11.
- U.S. EPA. Per- and Polyfluoroalkyl Substances (PFAS): PFAS National Primary Drinking Water Regulation. updated 2026-05-18. Retrieved 2026-10-11.
- U.S. EPA. PFAS NPDWR fact sheet: costs and benefits. 2024-04-08. Retrieved 2026-10-11.
- U.S. EPA. UCMR 5 Data Summary: July 2026 (EPA 815-S-26-007). July 2026 (final dataset). Retrieved 2026-10-11.
- USGS. Tap water study detects PFAS ‘forever chemicals’ across the US. 2023-07-05 (samples 2016–2021). Retrieved 2026-10-11.
- U.S. EPA. Private Drinking Water Wells. updated 2026-08-25. Retrieved 2026-10-11.
- U.S. EPA. Basic Information about Your Drinking Water. updated 2026-03-02. Retrieved 2026-10-11.
- USGS (DeSimone). SIR 2008–5227 abstract page. 2009 (samples 1991–2004). Retrieved 2026-10-11.
- USGS and CDC. Study estimates about 2.1 million people using wells high in arsenic. 2017-10-18. Retrieved 2026-10-11.
- USGS. Circular 1360 summary page. 2014. Retrieved 2026-10-11.
- University of Minnesota (Overbo, Heger and Gulliver). Evaluation of chloride contributions from major point and nonpoint sources in a northern U.S. state. 2021 (Science of the Total Environment). Retrieved 2026-10-11.
- Minnesota Pollution Control Agency. Chloride reduction program. retrieved 2026-10-11. Retrieved 2026-10-11.
- Madison Metropolitan Sewerage District (AECOM). Nine Springs WWTP chloride compliance study. 2015. Retrieved 2026-10-11.
- City of Waukesha. Water Softener Removal Rebate Program. retrieved 2026-10-11. Retrieved 2026-10-11.
- Wisconsin DNR. 2026 report on the City of Waukesha Great Lakes diversion (Oct 2024–Sep 2025 reporting period). 2026. Retrieved 2026-10-11.
- City of Lathrop, California (municipal code). Chapter 13.05: Water Softening Appliances. current code, retrieved 2026-10-11. Retrieved 2026-10-11.
- San Miguel Community Services District, California. Ordinance 01-05 restricting self-regenerating water softeners. 2005-05-09. Retrieved 2026-10-11.
- Madison Metropolitan Sewerage District. Chloride: For Residents. updated 2026-07-29. Retrieved 2026-10-11.
- USGS National Minerals Information Center. Mineral Commodity Summaries 2026: Salt. January 2026 (2025 estimates). Retrieved 2026-10-11.
- USGS Minerals Yearbook. Salt in 2023, Table 6 (tables-only release). 2023 data (tables include data through 2025-02-11). Retrieved 2026-10-11.
- USGS Minerals Yearbook. Salt, 2019. 2022 release (calendar 2019). Retrieved 2026-10-11.
- Water Quality Research Foundation / Battelle. Softened Water Benefit Study (Battelle study) executive summary. 2009 study. Retrieved 2026-10-11.
- World Health Organization. Hardness in Drinking-water: background document (WHO/HSE/WSH/10.01/10/Rev/1). 2011. Retrieved 2026-10-11.
- Gallup. Americans’ Rating of Environment Hits New Low (March 2–18, 2026 poll). 2026-04-14. Retrieved 2026-10-11.
- Minnesota Department of Health. Beware of Water Treatment Sales Pitches. retrieved 2026-10-11. Retrieved 2026-10-11.
- WHO and UNICEF Joint Monitoring Programme. 1 in 4 people globally still lack access to safe drinking water. 2025-08-26 (2024 data). Retrieved 2026-10-11.
- World Health Organization. Drinking-water fact sheet. 2023-09-13 (2022 data). Retrieved 2026-10-11.